
Google never fails to surprise audiences with its regular advancements in tools and technologies, such as Google Analytics 4, a replacement and advanced version of Universal Analytics. In the year 2022, Google launched the updated version of Google Data Studio and renamed it Google Looker Studio, which is the more advanced version of it. Google Looker Studio is an exciting tool, and it provides the option to convert all the monotonous data and reports into interesting visualizations with many varieties in charts and tables, giving you more control over your assets. It can also connect through over 600 connectors, like Google Ads and Google Analytics, and some third-party connectors for which you need to pay a certain amount. It also gives you the freedom to customize your dashboard and audit the reports from scratch.
What is Google Looker Studio?
Google Looker Studio is a data visualization tool by Google, which is an updated version of Google Data Studio with more features that give you the freedom to make customizable reports and tables; you can also edit and customize the dashboard according to your needs. You can connect various third-party platforms and their data and reports to make it more accessible and understandable; it gives you the feature to change all the data into exciting graphics and charts, use different fonts and colors, and also use videos to make it more accessible and easy to understand to your clients.
The best thing about Looker Studio is its dynamic reports; you can make any changes in the data and its visuals anytime if there is any change in your original data. You can also share your Looker Studio reports with any team members with editing access, just like Google Docs and Sheets. Looker Studio's approach to connecting from other data sources is entirely different from Data Studio's; to integrate data from another source, first, you need to convert its data into an SQL database; otherwise, Looker Studio will not be able to read it. The best thing is you can install AI tools in Looker Studio and use them to forecast and classify reports.
Preparing SEO reports is essential as it helps to know the performance of crucial SEO metrics that needs to be focused on. With various SEO metrics that can be targeted on by business it is crucial to analyze the performance of the important ones that matter the most for the business. Some of them include bounce rate, organic traffic, number of backlinks, domain authority, organic conversion, page speed, pages per session, website visibility, etc. Knowing the performance of these metrics helps to know the performance of the crucial metrics and takes necessary steps to optimize it.
How to set up Google Looker Studio?
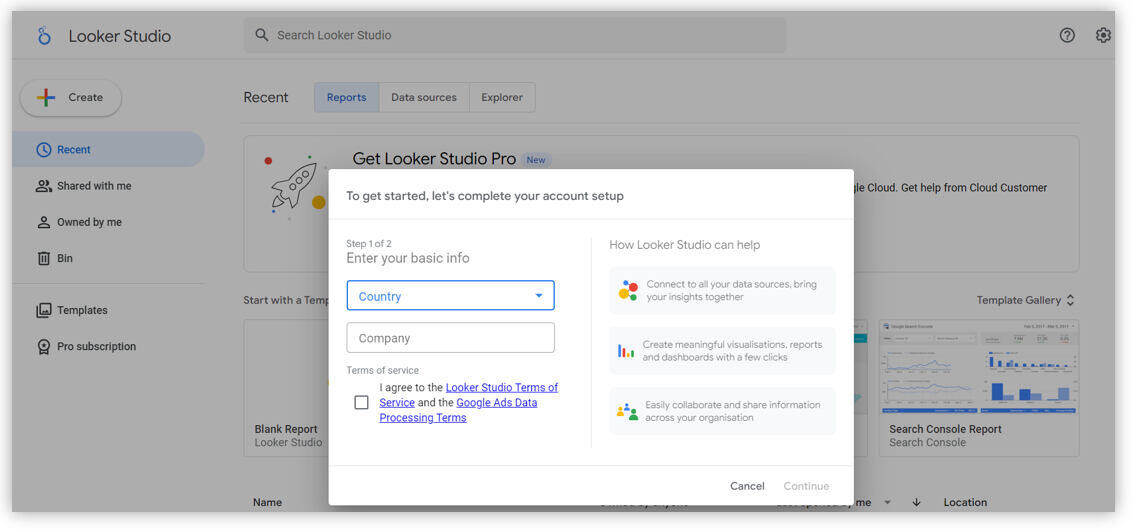
Step1. sign in to Looker Studio:- To sign in, visit Google Looker Studio and sign in with your Google account; make sure to use the same account that you used in Google Analytics or any other Google services in case you do not want to use your personal account then you can also create a new account for Looker Studio.
Step2. Fill up the information:- Fill up all the information; if you are signing in as a new user on Looker Studio, then you will be asked to fill in your name, company name, email preferences and the connector from where it will collect all the data to make a report.
Connect your data with Google Looker Studio
Google Looker Studio provides a variety of sources from which you can choose to prepare data and reports with engaging visuals that don't need any programming. Google Looker Studio provides data sets like MySQL and Big Query. It also can be linked with Google marketing and consumer platforms such as Google Analytics, Google Ads, Search Ads360, YouTube, and Google Search Console. You can upload files via CSV files and Google Cloud Storage. Social media platforms like Facebook, Reddit and Twitter can also be linked to it.
The best thing is that there are more than 700 partner connectors to sync data. To sync data from any connectors, if you are a new user, then you will be asked to add connectors while signing in to the account; in case you want to add more connectors, you can do it by clicking "Create" and then "Data source" from your homepage. You can add a new name to the data source; after selecting the data source, you also need to grant permission to it. After the process, you will receive a list of available fields to create the chart for any reports. Google will divide this into two categories:
A. Dimensions(Green): Dimensions are a type of data that categorizes your data into different subtypes such as country, age, product ID, campaign name and date. Google uses all these elements in your charts.
B. Metrics(Blue): Metrics are the quantitative measurement of data. Numbers, percentages, duration, and currency are some metrics you will find in the reports.
Creating reports in Google Looker Studio
Before creating data visualization reports on Google Looker Studio first, you need to decide for whom you are preparing the report, what he wants from those reports and on which metrics you want to focus; as you know, in Looker Studio, we can customize the reports and also add up the metrics from different sources. There are two options to prepare a report first: either to prepare it by editing a template or from scratch.
1. To prepare a report from scratch, click "Create" and choose "Reports" from the homepage.
2. Adding the connector is the next step towards making a report; if you have already done that, you now have to choose only the data you want in your report. If you want to add or select a new connector, choose from the available options. While creating any report, you can click "Add Data" in the data column if you want to add data from any other source.
3. If you want to add charts to the report, then in the toolbar on top of the editor, click on "Add a Chart" and select any chart for your reports. Don't worry about the process; you only need to drag and drop. You can also change the dimensions and metrics by clicking fields in the properties panel.
4. You can style your reports by clicking "Theme and layout" in the toolbar; also, there are options to add titles and banners to the reports.
Sharing the reports in Google Looker Studio
There are plenty of options available for sharing the reports in Looker Studio, which makes it more accessible than Data Studio; there are the following options available to you for sharing the reports:
1) Invite people
2) Share email delivery
3) Get report link
4) Embed report
5) Download report
Before inviting them to access the reports, you need to check the share setting first, as well as to share the reports through email; it's compulsory to have a Google account email so that they can be added as a "viewer" and "editor". There are also options available to restrict the users with editor access to add more users or change access. Also, you can disable the printing, downloading, and copying reports feature for the viewers. To enable these settings, click the "gear" icon in the right corner. It is necessary to check the safety settings before sharing the reports with anyone; you can check the safety options from:
A. Restricted: Only those you have shared the report can open the link.
B. Unlisted: Anyone on the internet can view the report with the link.
C. Public: Anyone on the internet can find and view the report with the link.
Customize your Google Looker Studio dashboard.
Editing or Customizing your Looker dashboard is like editing a template; the homepage editor interface is similar to Google Sheets and Docs. At the top of the screen, in the toolbar option, you can find:
a. New pages
b. Data sources
c. Images
d. Textbox
e. Lines
f. Shapes
g. Charts
h. Controls
You can add any of the features in your reports just by clicking on it, and the feature will be added to your report dashboard; still, if you want to place these features in some particular place on the dashboard, then you can also drag and drop it in a specific place. From the toolbar, you can also make changes to it by pressing the "Theme and Layout option" to open the style properties. You can find and make changes to header visibility, navigation and canvas size in the Layout tab. You can change the background and size of any specific page in your reports by clicking "page" and then the "current page settings" to open style properties.
Controls in Google Looker Studio
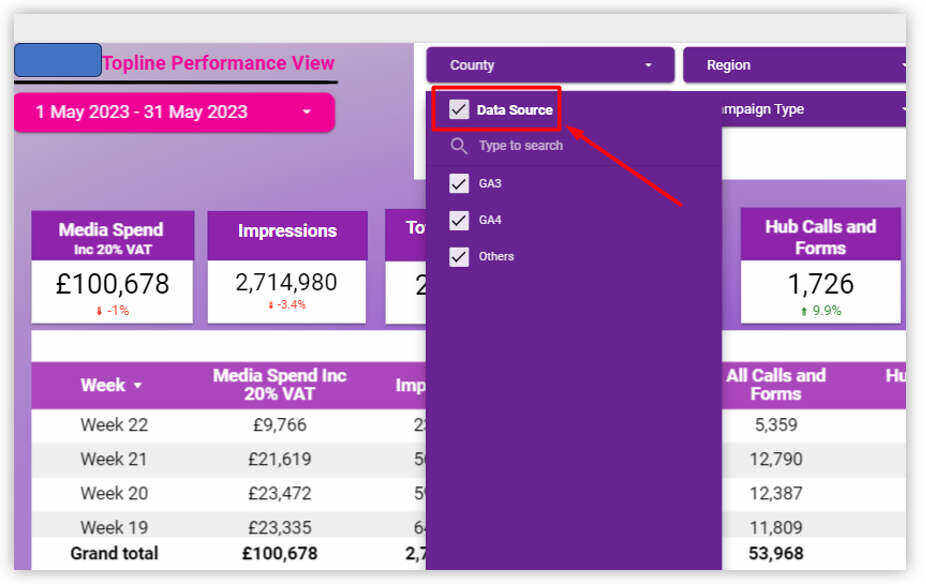
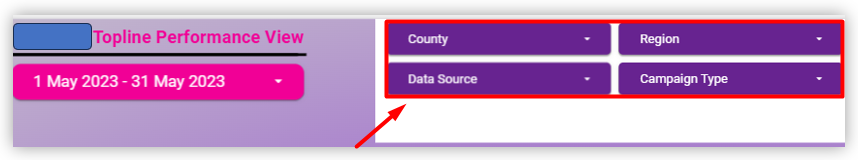
Controls in Looker Studio let the users act on the data with some key functionality; they make the dashboard panel very concise and easy to use for the users by making information easily accessible. Some features of controls in Looker:
A. Filter your data by specific dimension values.
B. Set up the time frame for your reports.
C. Set up parameter values that can be used in calculated fields and sent back to the connectors.
D. Change the basic data set used by data sources.
The controls are divided into two sections; the first section is used for filtering the data and setting parameter values. Some important controls in the first section are
1. Drop-down list- This shows only the data within the chart from a list of options chosen by users.
2. Fixed-size list- These controls are almost similar to drop-down lists. Still, the difference is that they already appear open, so users don't need to open them.
3. Input box: The input box lets the users manually type the value rather than select it from the list.
4. Advanced filter: advanced filters are similar to the input box, but the only difference is they can only be used for filters. Filters options include "equals", "contain", and "starts with", giving users more control over their search.
5. Slider: This control lets the user define a specific range or limit for metrics in the data
The second section is used for specialized functions and can not be used to set up the parameter values. For those users who control multiple dashboards, these controls are very useful for them.
1. Data-range control: Data range control lets you set the date range for all data on reports. This allows your viewers to see the data from the selected date range.
2. Data control: Data control lets you select the data set used by a report without editing the data source connection.
Types of charts in Looker Studio
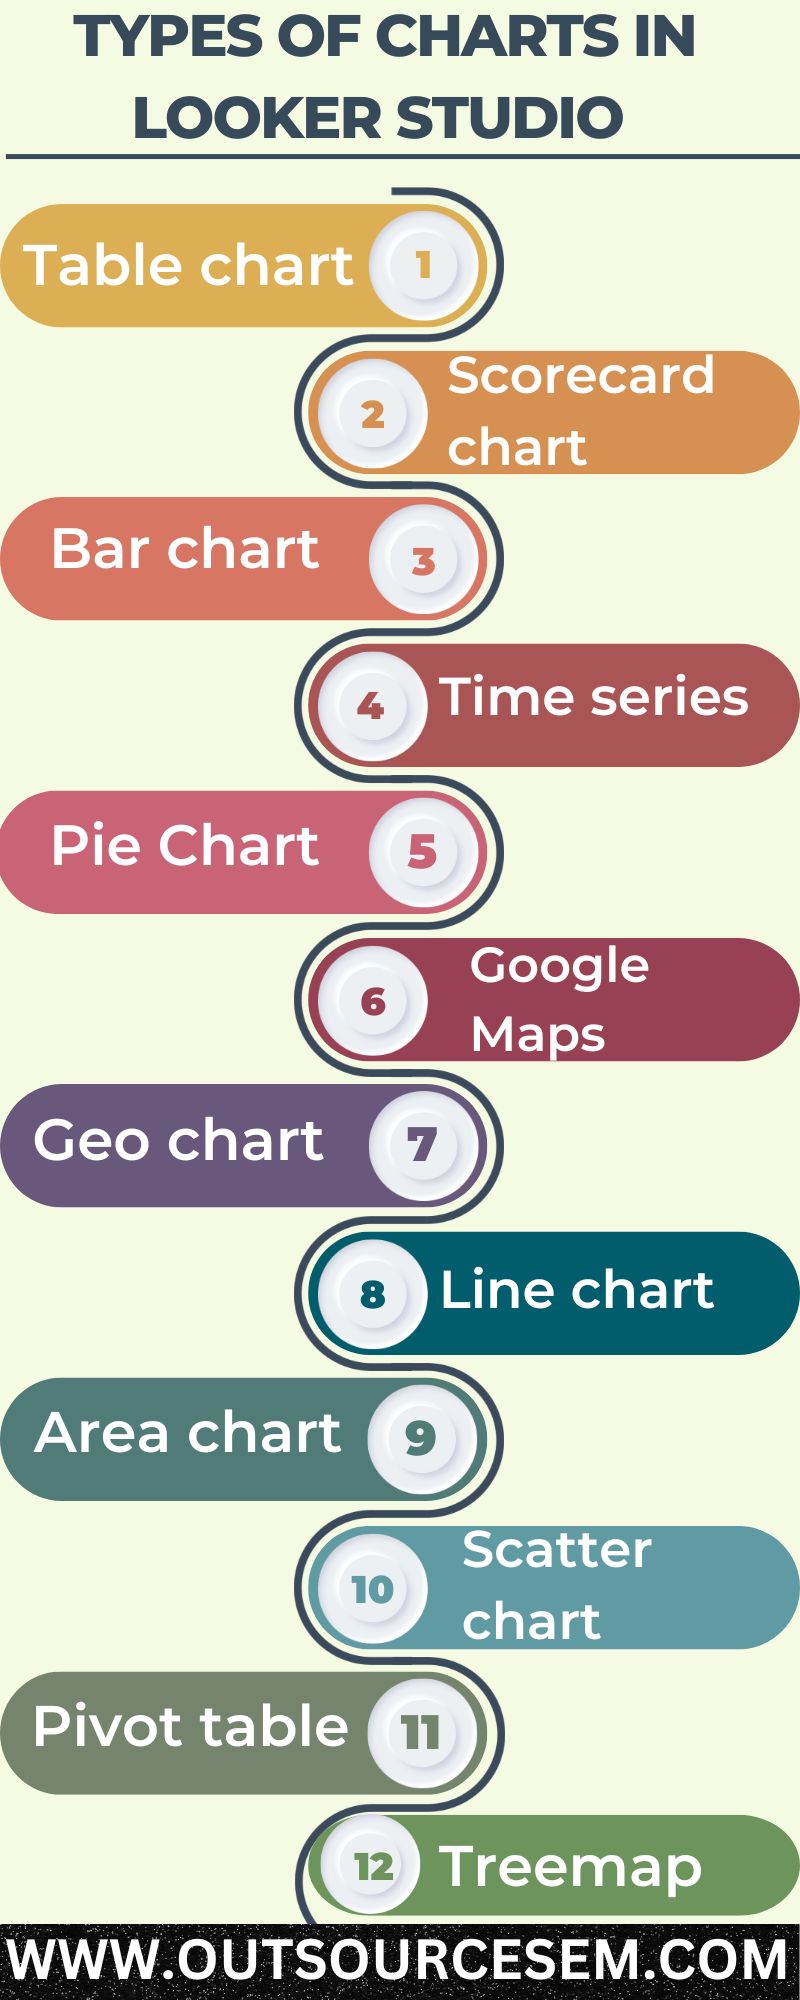
There are 14 types of charts available in the Looker editor. These charts are the main components of the Looker Studio dashboard, and each chart has its purpose: to show the correct data values, you have to choose the right chart. To add a chart to your reports, click "Add a chart" in the editor toolbar and select any chart you want from the list. Here are some of the charts that can be used in reports:
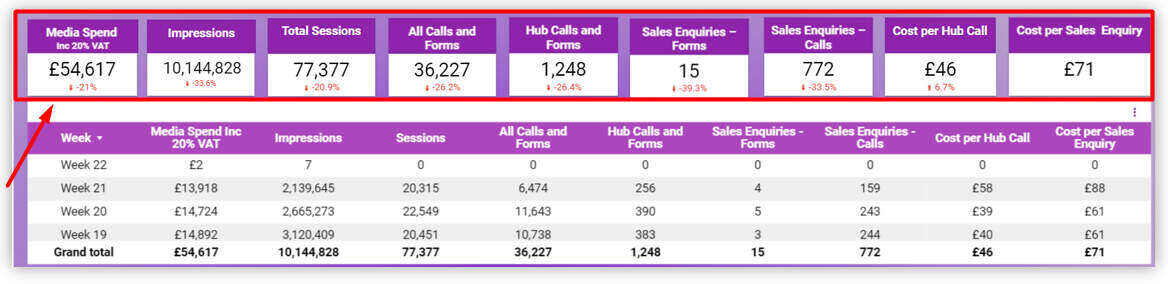
1. Table chart: when you need to show the data in rows and columns while making the reports. E.g., product items and category.
2. Scorecard chart: when you need to show just a single metric related to your report, you can choose the scorecard to display sales, bounce rates, etc.
3. Bar chart: The bar chart compares big data sets, highlights categories, or changes over time. For example, website traffic can be shown by the bar chart.
4. Time series: Time series shows how data changes over a while, like the website traffic in a session or over the week, and the profit margins can be shown through the time series.
5. Pie Chart: A pie chart can be used to show the small dataset and its proportions and percentages; this can go up to six categories.
6. Google Maps: Through the Google Maps chart, you can show the distribution of metrics worldwide to show the audience's position.
7. Geo chart: Like Google Maps, geo charts show the same metrics but in a more general way. The main difference is that you can't zoom in on a geo chart.
8. Line chart: Line charts are used to display the changes in continuous data or display multiple series on the same timeline.
9. Area chart: These charts are similar to line charts and are used to compare the data trends over time.
10. Scatter chart: Scatter charts are used to display the differences between two metrics up to three dimensions.
11. Pivot table: Pivot tables summarize a large data set; pivot tables help you narrow down the large data set and build the report by analyzing the relationship between data and points.
12. Treemap: Treemaps are used to show your data in an organized dimension hierarchy. You can use the treemap to show the annual sales in multiple product categories.
13. Gauge chart: A gauge chart helps quickly analyze how well a metric performs against a targeted goal.
14. Bullet charts: A bullet chart shows how well a specific metric performs against target benchmarks.
Conclusion
Google Looker Studio is an advanced data visualization tool that is a revised version of Google Data Studio that helps us make our data more engaging and easy to understand with various charts and tables and advanced visualization tools. Looker Studio provides us with the feature to connect with analytics tools such as Google Analytics, Google Ads, and more than 600 third-party connectors like SEMrush and Ahrefs. To set up your Google Looker Studio, you need to sign up with your Gmail ID that you have used in other analytics tools; after connecting these with Looker Studio, you can create visual and engaging reports from those data. You can also style your reports and make any changes to them easily.
Looker Studio can help marketers and businesses analyze and understand the data more efficiently and make better market strategies. If you find preparing and auditing the reports difficult, you can get help from out in preparing SEO plans and strategy, SEO analytics, SEO audits, PPC audits and digital marketing services or remarketing services; this will make your task easy, and the best thing is that professionals do these tasks for you so don't need to worry about anything. Looker Studio also has some controls and filters that can make your work easier by organizing your data and reports.
Looker Studio has 14 types of charts that you can use to display different types of reports and data with visualization effects, making it a flexible and helpful tool, especially for marketers to do better market research. If you are into businesses such as painting, plumbing, HVAC, electrician, flooring, roofing, etc., then OutsourceSEM provides various online marketing services to these businesses. To enhance your web presence for the local search results. We offer top-notch digital marketing solutions and provide businesses with SEO services and PPC services. We also help businesses and industries with developing their customized business website and offer social media services too for local businesses and much more with the help of our experienced digital marketing team.Similarly, for your home service businesses you can also avail our top -notch SEO services such as painting SEO, plumbing SEO, HVAC SEO, appliance repair SEO, construction SEO, etc. to boost your brand visibility and enhance the revenue of your business.
References:
- Google Data Studio (Looker Studio) Tutorial
- Welcome to Looker Studio