
While traditional and digital marketing both have pros and cons, selecting between the two is a business choice. With the increase in technological advancement, the fact that online marketing is at par cannot be put aside. With multiple benefits of online marketing over traditional marketing, the critical one is that it provides the option to track and measure every activity. There are multiple SEO metrics that can be tracked in Google Analytics and provide a real-time performance of the SEO campaign. However, there are certain metrics that are commonly misunderstood in Google Analytics. In this blog, there will be a discussion on the vital metrics that are misunderstood and how accurately analyzing them would help formulate the best plan & strategy that increases traffic on the website, boosts conversion rate, increases ranking on the SERPs, etc.
As search engine optimization techniques keep evolving with the SEO trends, the performance of the SEO metrics also changes. Keeping track of the essential SEO metrics helps know what SEO KPIs need to be optimized. Linking Google Ads with Google Analytics accounts helps to know the performance of various PPC metrics; similarly, you must set up your website with Google Analytics to analyze the critical metrics. Let us see some of the essential metrics misunderstood in Google Analytics.
What is Google Analytics?
Google Analytics is a free website analytics tool launched in 2005 by Google that lets you measure and analyze the data for your website. It helps better understand your customer and their search behavior. Google Analytics provides you with insights related to each of the SEO metrics so that you can particularly analyze them to improve the performance of your website and maximize the conversion rate.
After you have worked on all the essentials from creating a website, optimizing images, including eye-catching images, etc., then it would be best to track the performance of the essential metrics in Google Analytics. As you focus on writing engaging ad copies to lure the visitors' attention to your ads, in the same way, you need to write great content for your website so that the target audience is interested in navigating through different sections and takes the intended action. All these points are crucial so that you are sure of the fact all your SEO efforts are completed from your end.
Suppose you have been running an SEO campaign for the last one month and you don't see any improvement in the campaign because you have no access to any analytics tool to monitor the progress of your campaign. In this situation, you will not get any idea exactly where you need advancement. But if you are using any of the website analytics tools, then you have valuable insights that let you know where you can improve your performance or where you need optimization. Most of the users do not understand each of the uses and applications of the core metrics and tend to neglect them, resulting in the failure of the SEO marketing campaign. Following is the list of some commonly misunderstood metrics of Google Analytics that helps in boosting your website ranking and performance.
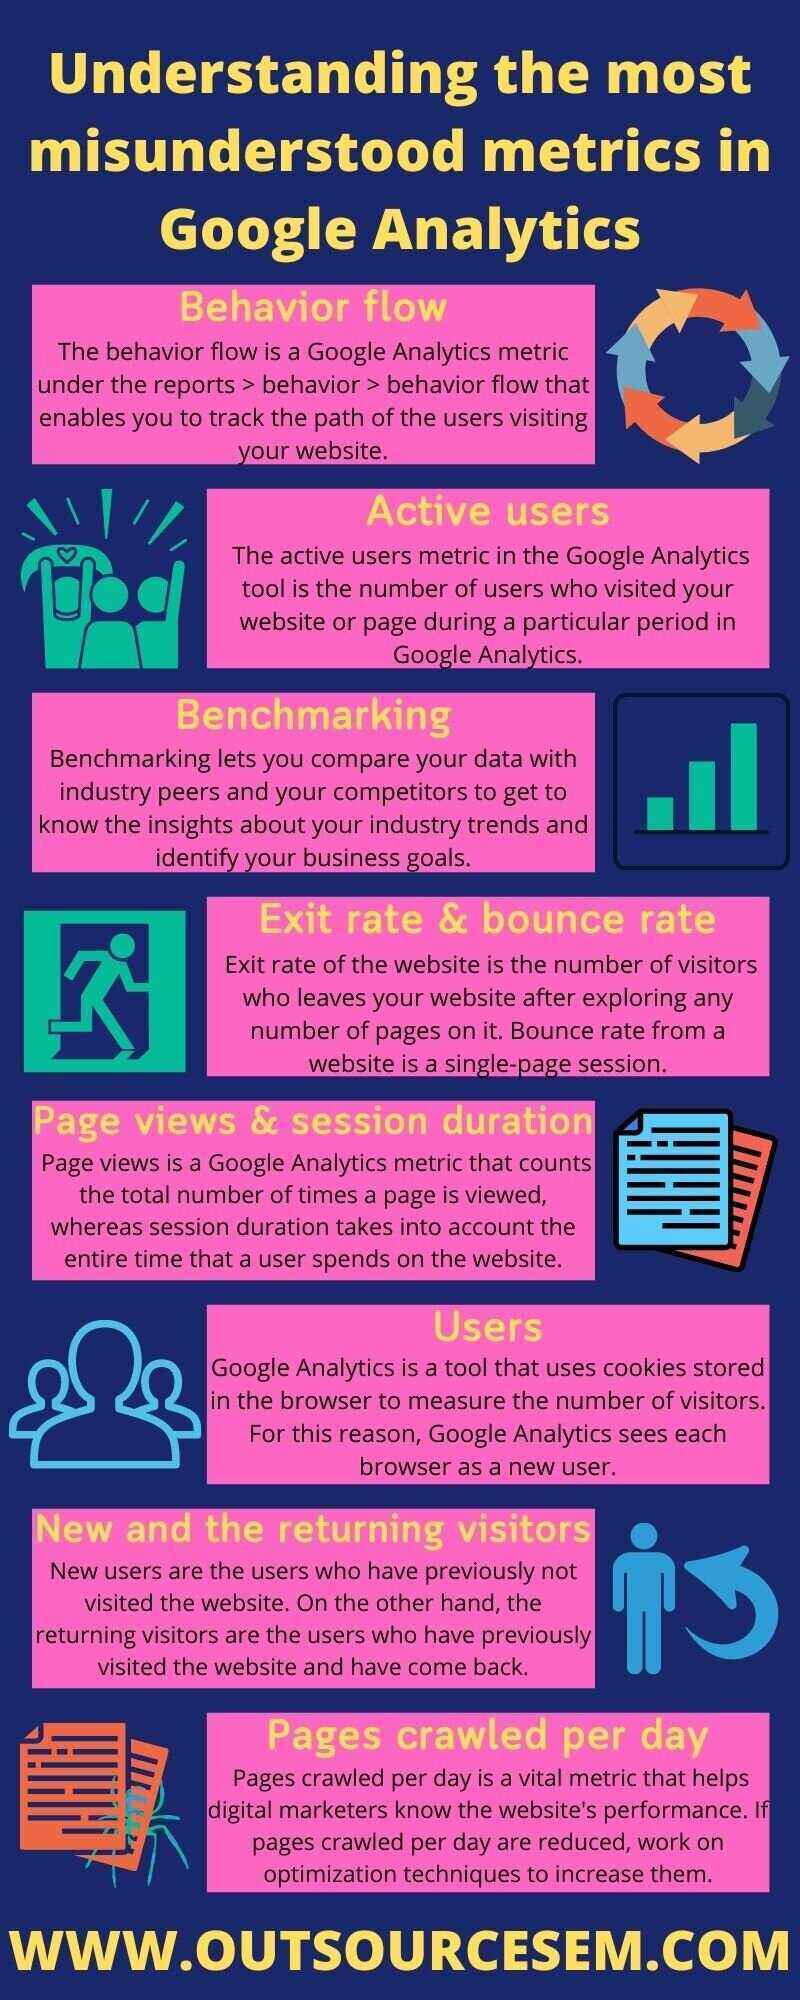
Understanding the most misunderstood metrics in Google Analytics
Behavior flow
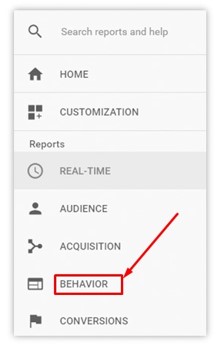
The behavior flow is a Google Analytics metric under the reports > behavior > behavior flow that enables you to track the path of the users visiting your website. By analyzing this metric, you can easily know how visitors are exploring your website, which page has the highest engagement rate and which has the lowest? Behavior flow is also useful for finding the page with the highest number of drop-offs, the number of users leaving the website on a particular page. High drop-off on a particular web page means that the page has some issues that the users are exiting your page on that particular page. It should be taken care of and need to be fixed immediately.
Analyzing this Google Analytics metric is also helpful for you to track users’ journeys and highlight the issue that users face during exploring your website. Finding and fixing these issues improve the user experience on your website and optimize your website so that visitors can easily explore your website. You can also find the essential pages on your website that are more helpful for users and keep them on the top so that it is easily accessible. Removing or reorganizing the less useful pages can prove to be a good SEO strategy for your website ranking.
Active users
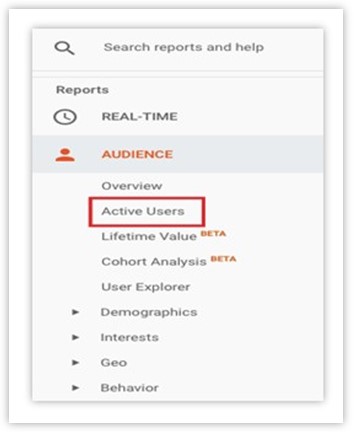
The active users metric in the Google Analytics tool is the number of users who visited your website or page during a particular period in Google Analytics. It is for 1-day, 7-days, 14-days and 30-days. You can select any time frame to see the number of visitors visiting your website in this particular period. 1-day active users mean the number of unique users who initiated a new session in one day; similarly, 7-day active users are the number of unique users who initiated a new session in the past 7-days and so on.
The active users metric is used to know whether your page or post or promotion is successful or not. Suppose you added a new page on the website and want to know whether it is successful or not. Then you can check the number of visitors on the website after publishing that particular page. Compare the data you find with the different time ranges are 7-days, 14-days, and 30-days and see whether it is the same number you would expect to get. If yes, then you are doing good and if not, then you have to optimize it more to get sufficient traffic. Most users confuse that the active users are the same as real-time users but both are entirely different metrics. Real-time users are the number of users using your website right now.
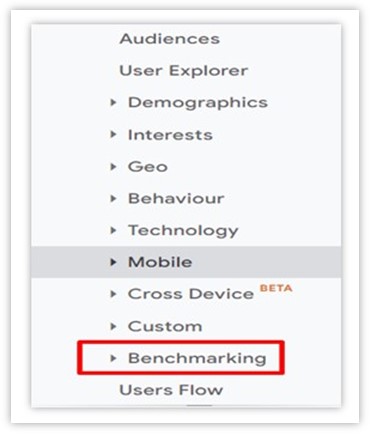
Benchmarking
Google Analytics for the website has various metrics that help analyze your website's performance. In this order, benchmarking lets, you compare your data with industry peers and your competitors to get to know the insights about your industry trends and identify your business goals. Many companies share their data which is displayed in benchmarking from where you can compare where each SEO metric is performing. Benchmarking can be found in the reports > audience > benchmarking, where you can choose from the three reports:
• Channels (Social, Direct, Referral, Organic Search, Paid Search, Display, and Email channels)
• Location (Country or territory)
• Devices (desktop, mobile, and tablet)
Here you can see the detailed comparison for the number of metrics like email, organic search, direct, paid search, social, referral, etc., against benchmarks such as sessions, % new sessions, new users, pages/session, avg. session duration and bounce rate. By analyzing these metrics, you can clearly state the areas in which you are underperforming and the areas in which you are doing good.
Exit rate & bounce rate
When visitors leave your website, it is called exit from the website. While the exit rate of the website is the number of visitors, who leaves your website after exploring any number of pages on it.
The formula for calculating exit rate = Number of exits/number of page views for a specific page.
Exit rate in Google Analytics can be found under the section behavior > site content > all pages. The high exit rate on a particular page signifies that there might be some issue with the page that visitors are leaving your website. As a website owner, you have to find and fix these issues immediately to maintain the flow of users while exploring your website.
Bounce from a website is a single-page session; when users land on any of your website pages and leave without taking any further action (such as clicking any link, exploring any other pages or forms, etc.) is considered a bounce. The bounce rate is the number of visitors who exit your website after landing on a page that is also known as the single-page session.
The formula for calculating bounce rate = single-page session/total number of sessions.
The bounce rate in Google Analytics for websites can be viewed under the section behavior > site content > all pages; there, you can view the row of bounce rates showing insights of all pages. The reason for the high bounce rate on a website or page can be many, but some of them are slow page loading speed, irrelevant content, bad user experience, technical errors, irrelevant title tag, meta description, call-to-action, etc.
Page views & session duration
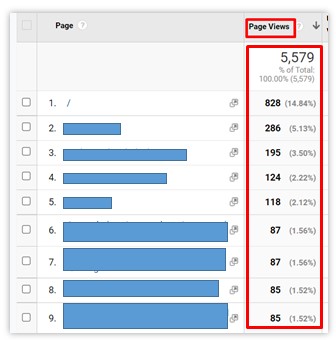
The page views & session duration are the next essential metrics which is misunderstood in Google Analytics. Page views is a Google Analytics metric that counts the total number of times a page is viewed. Page views are not a real-time reporting metric to date, meaning it can take up to 24 hours for Google Analytics to count the pageview. The page view is not about marketing or traffic acquisition, but it gives a clear idea of the user behavior on the web page.
The more useful the user finds and likes your webpage, the better the page views. This helps to know the user engagement and work on updating content on the webpage, improving page loading speed, etc., so that more users get attracted to the website. The easiest way to determine a pageview is the time browser takes to load a page. E.g., When you reach different pages on a website, then it is counted as a single pageview. Another point is that when you type a page URL but do not enter the page. Then also, Google Analytics metrics are counted as a single pageview. In social media marketing, if the online platform takes you from one website to another, it is also counted as a single-page view.
The session duration is defined as the time frame during which regular active interactions are occurring on a website. Session duration in Google Analytics metrics takes into account the entire time that a user spends on the website. The session duration defined depends on the choice of the business on what the marketer wishes to keep them as sessions. This can vary depending on the choice of the business from 15 min, 30 min, etc. When the time duration of the session gets over, then the session gets over. And if the user continues to browse through even after the session duration has crossed, it is counted as another session. The session section can be found in the behavior>site content>landing pages report, where you can find the avg. session duration of the web pages.
Users
Google Analytics is a tool that uses cookies stored in the browser to measure the number of visitors. For this reason, Google Analytics sees each browser as a new user. When the same user enters a website from a different device, Google Analytics considers it a new user. Google Analytics counts a particular session as a single user and every time the session is timed out or the duration is over, it is defined as a new session. To increase the number of users to your website, you need to focus on offering products or services that is sync with the latest marketing trends. This helps increase the users' trust in the website, builds brand awareness, etc. You also need to focus on link building so that your website generates links from white hat websites. The products or services you offer should be such that the business chooses your website again when performing similar searches. It also helps in peer-to-peer marketing as they are most likely to promote it to their friends & family.
The Google web analytics help know the number of users interested in taking the intended action on the web page. As in PPC ads, the digital advertisers focus on choosing the users with high chances of taking the intended action and even add negative keywords when selecting the keyword match type. In the same way, with website traffic analytics, you get to know the details of users who have a high chance of converting into customers. The SEO services can be of great regard in this help as it helps you get the users looking to avail of the products or services.
New and the returning visitors
The new vs. returning visitors is the next essential metric that is misunderstood. When using Google Analytics for a website, this helps to know the number of users interested in taking the intended action and the users who are just doing window shopping.
In Google Analytics metrics, new users are the users who have previously not visited the website. On the other hand, the returning visitors are the users who have previously visited the website and have come back. The new and the returning visitors are also essential as the website traffic analysis is done based on them. Having a clear idea of who the users are to your website gives an idea of the necessary points that need to be included in your SEO plan & strategy. You can then work on optimizing images, organizing content on the webpage, etc. However, you should focus on the point that you do not mix up the two, i.e., the new users and returning users, as these are different. The SEO services can help analyze these metrics as a misinterpretation of these metrics may lead to an increase in SEO mistakes. The SEO services help enhance the performance of the SEO campaign to achieve the desired results like increasing the impression share, website traffic analysis after the changes are made, etc.
.jpg)
Pages crawled per day
Using the Google Analytics metrics is vital as it helps the digital marketers know the website's performance. The point to focus on in this is the pages crawled per day. This helps to know how many pages Googlebot crawls every day. The more search queries relevant to the product or services your business offers, the higher the chances of Googlebot crawling the page. However, the crawl rate is different from the metric domain authority. The reason is that you cannot change how often Google crawls your site as the search engine’s artificial intelligence controls this.
The website analytics helps to know the pages crawled per day so that when you get to know that the pages crawled per day are reduced, you can work on optimization techniques to increase them. The Google web analytics is thus essential that helps to know this crucial metric and improve it in sync with the latest marketing trends.
You need to ensure that the product or services that your business offers are in sync with the ones shown on the search result page. As you focus on ad relevancy in PPC advertising, the same focus on webpage content increases the users' trust in the website. It builds brand awareness, boosts peer-to-peer marketing, helps in affiliate marketing, etc. If you determine that the crawl result for your page is getting lowered, this could be due to some of the reasons mentioned below.
a. You may have broken code on or more of your pages.
b. Robots.txt may be blocking too much.
c. The page loading speed may be very slow.
d. The canonical tags may not be present.
e. The page may have duplicate content.
Conclusion
With analytics tools like SEO tools and PPC tools available to digital marketers, the work of digital marketers is accessible in the online marketing world. Google Analytics is a very effective tool that is capable of generating detailed and comprehensive data. It provides insights needed to fine-tune your website and maximize conversion rate. However, to use it effectively, you need to know how to interpret the data so that you can use it to the best in your plan & strategy in strategic marketing.
As you focus on website analytics to know the essential metrics that affect your website's performance. Google Analytics for website helps to perform website traffic analytics, average session duration, bounce rate, new v returning users, etc. To have the best advantage of Google Analytics, you can outsource SEO services so that there is no confusion in understanding the essential metrics. You can get in touch with a digital marketing company that provides SEO services, such as SEO audit, SEO analytics, white label SEO reports, SEO reseller services, etc. Also other services can be availed like social media marketing services, backlink analysis, SEO copywriting services, reputation management, SEO detox and penalty removal, etc for your business. By hiring our digital marketing experts you can avail various services like painting SEO, appliance repair SEO, electrician SEO, construction SEO, HVAC SEO, small business SEO, dental SEO, etc for your business. Through these services you can increase website traffic and bring more leads and conversions for your business.
References
• The six most misunderstood metrics in Google Analytics
• 9 important SEO metrics to track (+ how to improve them)
• Google Analytics – metrics that are commonly misunderstood