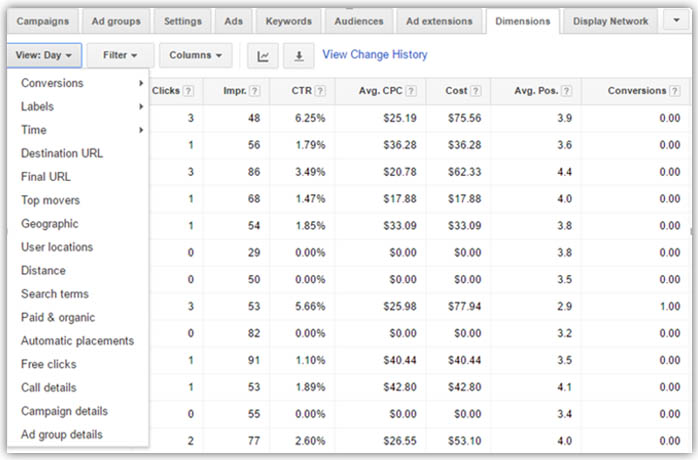
You might be wondering what’s so awesome about dimensions tab. Well…let me tell you all about it. Dimensions tab helps you slice and dice your entire data by dimension of your choice and view total statistics by month, hour, geographic location etc.
There are various options available in dimensions tab which can develop your PPC company, lets discuss each one by one.
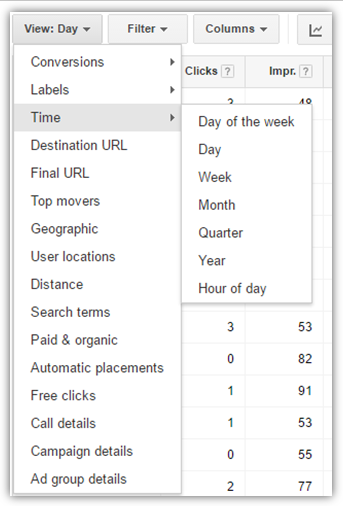
Time
This is one of the very important reports which can definitely help you during ppc campaign optimization. You can segment your data on the basis of day and check that whether there is any particular day of the week for which you are getting more conversions or whether there are days in which you are getting high traffic but no conversions. What you can do is you can increase the bids for the days you are getting more conversions and decrease the bids for the days you are getting no conversions. You can do the same with hours of the day or week and then make your online marketing strategy accordingly.
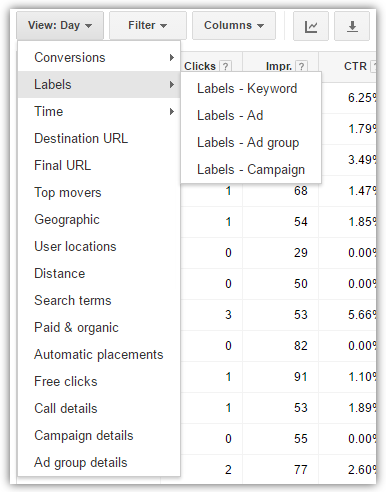
Labels
This dimension is of great use if you are running test campaigns/ads/keywords in your Google Ads account. Using this dimension you can easily compare the data of test and actual ads or campaigns.
Geographic
Geographic dimension shows your customers’ physical location or locations they are interested in. There is another dimension below geographic dimension that is user location. Confused between both? User location data shows only your customers’ physical locations, regardless of any location they are interested in. For e.g. – You are located in India and searching for restaurants in Australia then geographic location would record the data as Australia and user location would record the data as India. Using this report you can always compare the data between location of interest and user location. In the below screenshot we can see that about 13% percent of the total conversion is coming from locations other than the targeted locations. This report helps you in identifying possible locations that will improve your results.
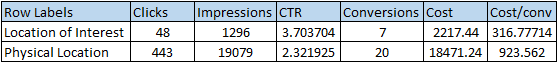
This report can also give you better insights if you are running a local campaign. With PPC campaign analysis you can always check for areas giving you best results and hence you can allocate the budget for areas accordingly.
Search terms
Search term are actual queries people had searched and your ads were shown for them. This dimension could be of great help as you can always pick the irrelevant terms for which you are getting clicks and add them as negatives. Not only this, it also helps you optimize or grow your account by providing you more keywords. It also helps you in increasing conversion rate and CTR.
Conversion
When you select this dimension there are two options available –
Conversion category: This shows the purpose or category of your conversion.
Conversion name: This is the name that you have given to the conversion.
This report can be of great use if you are having multiple conversions across your campaign. Say for e.g. you offer a large collection of white papers and a free trial. So by differentiating a free trial as signup and white paper or registration as lead you can easily track where the conversion is coming from. You can outsource CRO services to increase your conversion rate.
Destination URL
This dimension helps you in analyzing the performance of different destination URL across the ad groups. Say for e.g. you have three ads in every ad group and each going to different pages- say one of them is going to home page, other is going to service page, and other is going to test landing page. You can view the performance of all these three URLs at campaign level and hence choose the one that best suits your ppc campaign.
Paid and Organic
This is another amazing report which helps you analyze not only paid traffic but also organic traffic via Google Ads. This is done by linking your Google Webmaster (Google Search Console Tool) account with Google Ads. This report is the first to let you see and compare your performance for a query which is appearing on both paid and organic search. This report can be very helpful as its shows the list of queries for which you appear only in organic search . You can include them in paid search also so as to improve your presence. This can also be very helpful in remarketing of products and services.
Automatic placements
This report is similar to search term report as it shows the webpages, videos or apps where your ads were shown. If you are running a display campaign or probably a remarketing campaign and you have set the targeting method other than managed placements then your ads will automatically appear on the website. This PPC report analysis process will show the list of websites where your ads has been shown and hence you will know which sites are driving more traffic and which are not. After knowing the placements that are best for you what you can do is you can create different ad groups with individual adgroup placements and check how they perform over time.
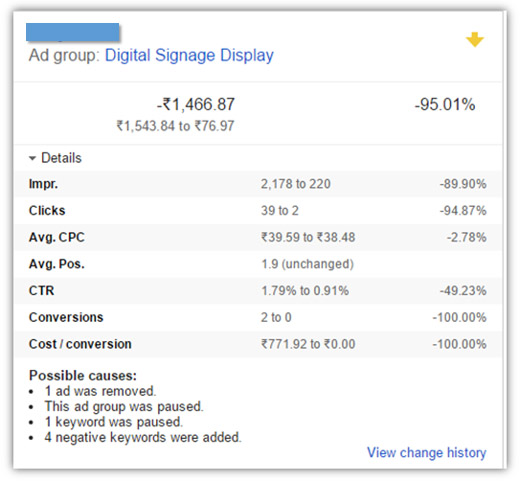
Top Movers
This added report fairly gives a basic idea of how your campaigns and ad groups have experienced the biggest changes over the past 7, 14 or 28 days. Not only this, it also shows the possible causes of change.
Free click
This report provides you with data about how people interact with different components of your ad and about actions they take. Say for example you have an expandable image ad then you won’t be charged if any customer clicks on your ad. You will be charged on the basis of ad format. So if any person clicks on your standard text headline which takes him to the landing page then you will be charged but if he clicks your ad to initiate a video or content then you won’t be charged right away but may be after when a particular action is taken. This dimension could be very useful if you have an e-commerce website. The product plus box can help you understand what is happening with your ads between the clicks and impressions. You can check whether they are clicking the plus box but not clicking through.
Call details
This dimensions can be helpful if you are using call extension with a Google forwarding number. This report shows you the caller area code, call duration, status etc. And this can be very helpful in increasing the lead generation for the product and services. so as to understand you the quality of leads different campaigns are driving.
Distance
If you are using location extension in your Google Ads campaign then this report will show the distance between your business and location that triggered your ad and your closest business location. For e.g. If you own a restaurant and want to check how your ads are performing when your customers are far or near from the store. So what you can do is, pull out the distance report. Suppose you found that people living within 5 miles of your restaurant show higher conversion rates then people living far. Using radius targeting and location bid adjustment you can increase the bids for people living within 5 miles area. This can also help you to increase your local presence through the local ads.
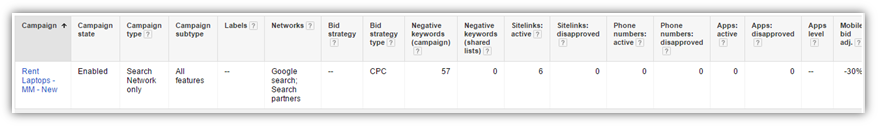
Campaign and ad group details
This dimensions helps you quickly review the campaign/ad group and its performance details through this report. You can choose the campaign or ad group and check things like campaign state, campaign type, campaign subtype, negative keywords, sitelinks and phone numbers.