Reports are integral to measure the performance of any digital marketing strategy. They help in identifying actionable steps to meet your business goals. Well-built reports unveil new pockets for growth and help you make bolder decisions and take advantage of new opportunities.
A PPC report is a means to understand the performance of a campaign in a better light. Starting a campaign is not the end of it. One needs to keep in check the performance of the campaign as only then can we work on optimization when we have the data to compare the performance of it. A good white label PPC report gives you crutches while performing PPC campaign analysis and gives a comprehensive overview of the effectiveness of the campaign. These reports also highlight if there is a need to conduct a PPC audit. PPC reports go beyond numbers and help in a comparative study illustrating key information through insight and analysis.
An SEO report is great to track and highlight the areas of your website that require improvement. They help in the overall assessment of your SEO strategy and explore new ideas for optimization. SEO reports are also effective in monitoring progress. This vital report should be both elementary as well as robust to understand how the SEO campaign is performing and whether there is a need to conduct an SEO audit. An effective white label SEO report should convey the progress and insights on the campaign and highlight areas that need improvement.
Creating a white label report can be an overwhelming job as there's always a lingering fear that you're providing too much or too little information. There is no thumb rule or one-size fit all approach to reporting. There are many different metrics, charts and even types of reports that you can use to create a report that's suited to your requirements.
What is MTD?
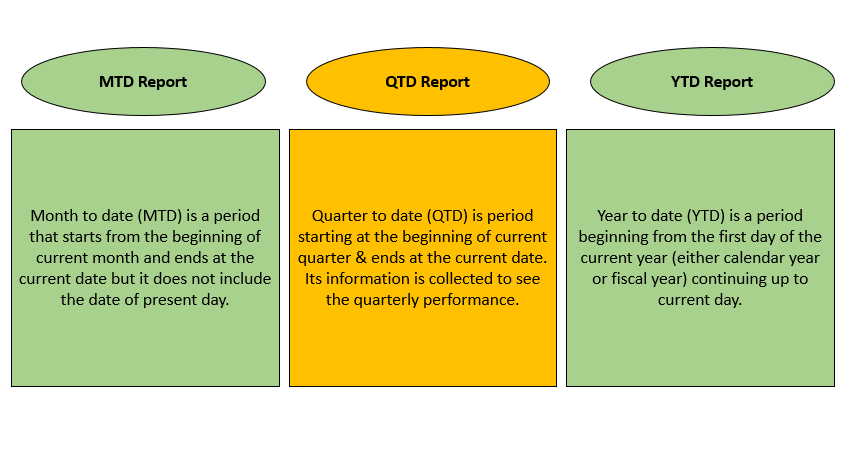
Month to date (MTD) is a period that starts from the beginning of the current calendar month and ends at the current date, but it does not include the date of the present day. This is because the end of business for that current day has not yet occurred. Suppose, if the present day is 19th september, then your MTD will cover the data from the time period of 1st september – 18th september. So, if the month to date (i.e., 1st september - 18th september) CTR is 1.72% then that means from the beginning of the current month until the current date the CTR is 1.72%.
MTD report provides you the information regarding your campaign for that particular period of time. The report helps in comparing the campaign's current period's performance to that of past periods. MTD can help you identify trends and predict future behaviour. Now, there are different metrics and key performance indexes (KPIs) to measure and compare, so plotting and reviewing the data on the MTD scale can help you identify problems with real-time data.
What is QTD and YTD?
QTD:Quarter to date (QTD) is a period that starts at the beginning of the current quarter and ends at the current date. Be mindful while making QTD reports as a quarter to date is used in many contexts, which is the beginning of either the calendar or fiscal quarter. QTD is like a financial tool that captures all the activities of the company that had occurred from the start of the quarter up to the date at which the activities were collected during that period. Its information is collected in order to allow the management to see the quarterly performance and also gives an overall view of how the quarter shapes up.
Key facts for QTD
• Quarter is a three-month period during a financial year, hence there are 4 quarters in each fiscal year.
• QTD analysis is always useful later in the quarter, when there is substantial data to analyze.
Why QTD matters?
Quarter-to-date comparison is quite useful as you can look for trends and can measure the performance. In the context of finance, quarter-to-date provides financial statements including details of the performance of a business. Moreover, it highlights all the activities that are undertaken by the company from the start date of the quarter to the date up to which the information was gathered. Hence, it informs the corporate decision-makers about the progress in the business in that particular quarter.
A year is usually divided into four quarters, i.e., quarter one (Q1), quarter two (Q2), quarter three (Q3) and quarter four (Q4). This segregation of quarters is useful in the analysis of performance on all scales. For instance, by analyzing the performance of a campaign at the end of Q1, you can take actionable measures for Q2.
For example, if your conversion rate drops in the second quarter of the financial year, then you can assess various factors that caused this dip in performance from Q1 to Q2. Perhaps it could be the festive season that resulted in an increased conversion rate in Q1 which wasn't the case around Q2. There could be many other trends that resulted in an increased conversion rate in Q1. QTD information helps in the evaluation of these factors based on which you can devise a conversion-driven strategy for Q3. Similarly, you can assess any other important metrics or KPIs on a quarterly basis and formulate a plan accordingly for the upcoming quarter. If you outsource PPC reports, then you can ask your agency to assess quarterly reports and draft a plan of action for the upcoming quarter.
If correctly used, QTD information can help any campaign improve its performance constantly, as there is a wealth of data available every quarter to work upon. That being said, QTD report is most effective towards the end of the quarter as there are rich data available to assess the quality of results.
How QTD works?
For example suppose a company named ‘ABC pvt. ltd.’ began business on january 1 and ends on march 31. During this particular period, company ‘ABC’ recorded some data which is listed below:
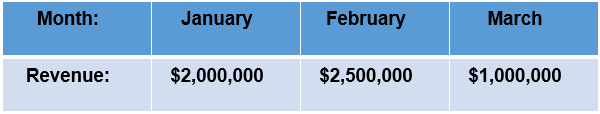
Now, you can easily calculate the quarter-to-date revenue. By adding the revenue of the three months listed above. Hence, QTD revenue is $5,500,000.
YTD: Year to date (YTD) is a period beginning from the first day of the current year (either calendar year or fiscal year) continuing up to the current day. A calendar year is a period from january 1st to 31st december whereas a fiscal year is a time period lasting for a year but beginning from january 1st is not necessary. The information gathered from YTD is quite useful for analyzing the improvement in the business, comparing the performance data, analyzing business trends, determining investment returns, etc.
YTD information is reliable to check your PPC or SEO campaign’s performance on an interim basis rather than waiting till the end of a fiscal year. Analyzing YTD data against the historical YTD data through an equivalent period consistently can help in assessing the changing trends and the overall performance of a campaign for the given period, thus revealing new pockets for growth. YTD information gives an accurate picture of where your business stands currently. It allows for easier comparison with previous years' data, helps in comparing performance across various KPIs, provides data for growth projections or needed budget cuts, etc.
YTD report can also be used to carry out a mid-year review of your ad campaign, track financial decisions over the last six months and look at projections over the rest of the year. In case you outsource PPC services to a digital marketing agency, you can demand YTD reports to assess your campaign performance on different parameters. Based on this data you can make informed decisions on what the long-term and short-term goals should be for your ad campaign.
Key facts for YTD:
• In some organizations, fiscal years may begin on any other day than january 1st.
• This analysis is beneficial for the managers to review the current campaign performance in comparison to previous campaign performance.
What is YTD return?
YTD is basically the amount of either profit or loss that has been generated by an investment since the starting of the current calendar year, which is usually the 1st of january or first fiscal day of the year or the first trading date of the year.
Key facts for YTD return:
• Year-to-date (YTD) returns basically refers to the amount of either profit or loss which has been produced by the investment from the beginning of the current year.
• Through YTD returns comparisons between investments and their targets can be easily made.
• YTD return is mostly used for measuring the performance of an investment from the current date to till the start date of the year.
• To calculate the YTD return, you need to deduct its value on january 1st of the current year from its current value. Then, the difference is divided by the value on january 1st and lastly, the product is multiplied by 100 for percentage conversion.
Why month-to-date comparison is important?
Month-to-date is essential to record the results, at the end of any given month. In the context of digital marketing, the MTD report plays a crucial role in understanding the campaign performance in monthly cycles. This report helps in understanding the campaign status, and analyze trends, in the given period the report is made.
Another great thing about the MTD report is that you not only get the MTD result of the current month but also of previous months. Hence, the managers or investors can easily compare the current performance of the company with that of the past periods. Like for example: suppose the MTD return for the stock is 7%. So, this means that from the beginning of the current month until the current date, the stock has been appreciated by 7%.
While creating the MTD report, the date for comparing the months should be clear and established in the very beginning. If it’s not, then the data of the MTD report may be incorrect and misleading, as the measures are more sensitive to early changes than late changes.
CSR KPIs in reports:
Call summary report (CSR) evaluates the success of an organization. It is basically the phone summary report that provides details of all the calls which are later managed by the support team. CSR reports can be used in finding which hotlines are receiving the greatest number of calls, where to allocate more helping agents and which agent is handling the calls quicker and better. Key Performance Indicator (KPI) is a type of measurement value and it demonstrates how successfully your company is achieving the aim of the business. Basically, these are quantifiable goals that help you gauge the performance of an ad campaign. Through these indicators, you can easily gather information and analyze the reports regarding the performance of an individual, group, organization, etc. By creating a specific set of KPIs, you can measure performance of your campaign and track goals based on those values.
Key metrics in MTD report:
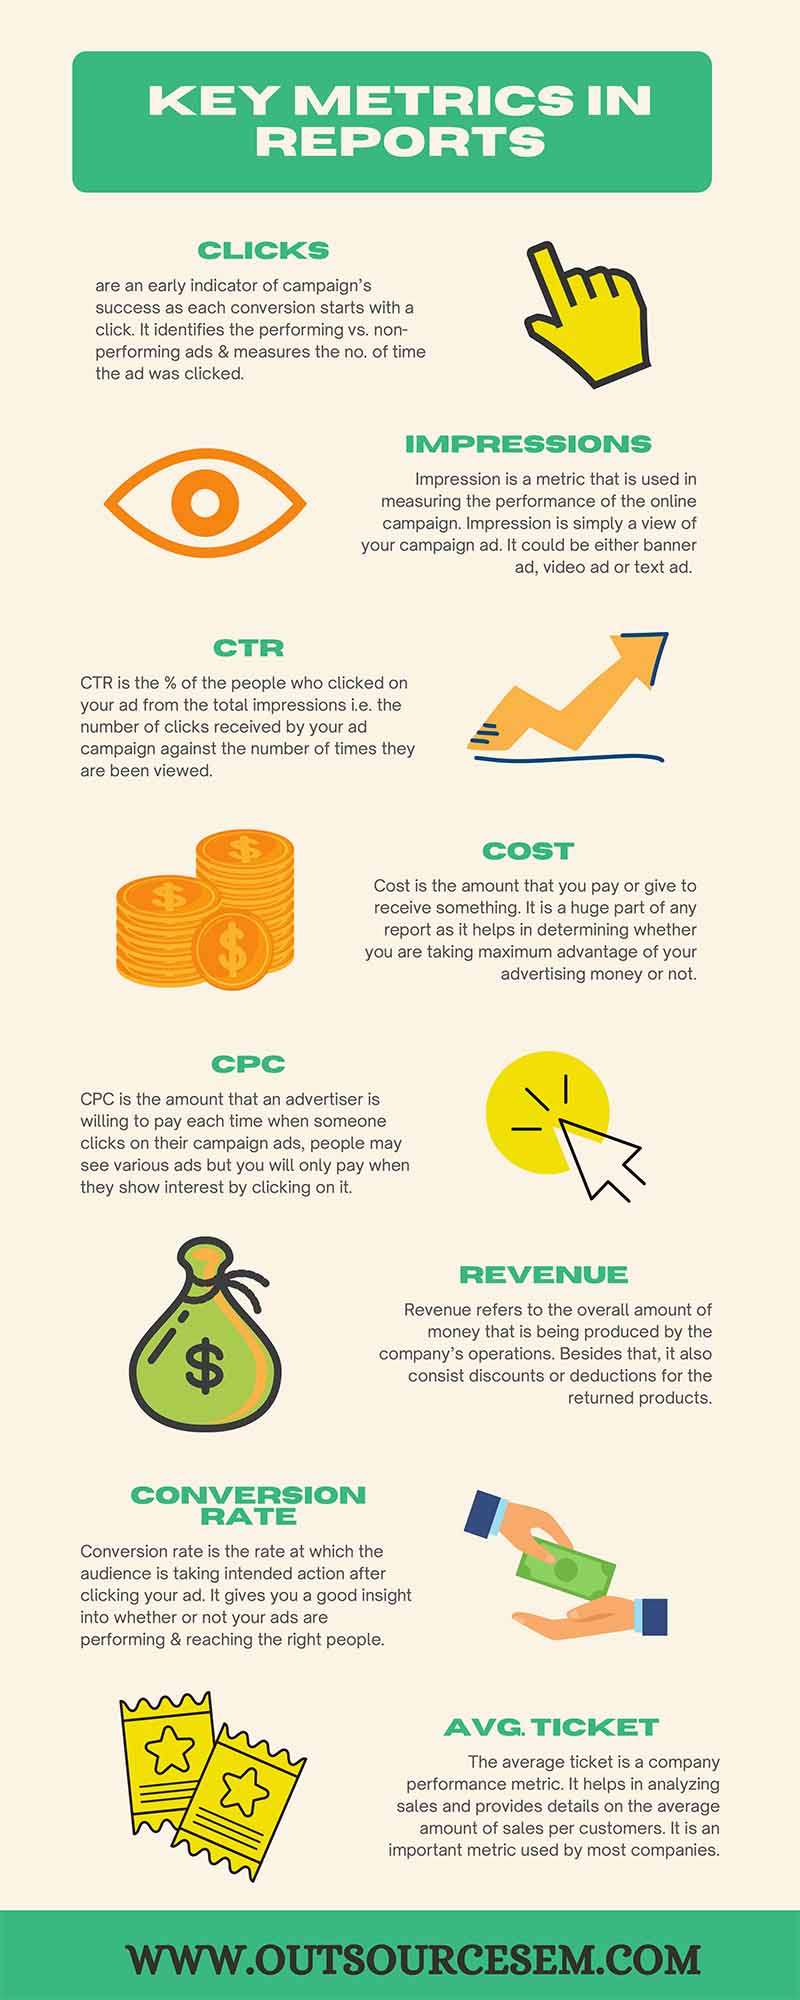
Clicks
There are different KPIs (Key performance indicators) that are used for determining the success of the campaign, click is one of them. These (clicks) are an early indicator of a campaign’s success as each conversion starts with a click. It basically identifies the performing vs. non-performing ads. and measures the number of individuals who clicked on your campaign ad.
CPC
Cost per click or CPC is the amount that an advertiser is willing to pay each time when someone clicks on their campaign ads, people may see various ads but you will only pay when they show interest by clicking on it.
Formulae: Cost/Clicks
Impressions
Impression is a metric that is used in measuring the performance of the online campaign. Impression is simply a view of your campaign ad. It could be either banner ad, video ad or text ad. The impression metric group (Impression share, exact match impression share, lost impression share budget, lost impression share rank and unique impressions) provides great insights that can be utilized to optimize ad campaigns.
Unique impressions
are the unique number of users who view your ads irrespective of how many times they viewed it.
• Note: Suppose, the same person views your campaign ad on multiple devices (desktop, tablet, mobile) then, they will be counted as a unique impression for each of the device.
1 view = 1 impression.
Impression share
is the total number of impressions that your campaign has received divided by the expected number of impressions that you were eligible to receive.
Exact match IS
is a percentage that is obtained by dividing the number of impressions that the campaign has received for searches matching the keyword by the expected number of exact match IS that the ads were likely to receive.
Lost impression share budget or search lost IS (budget)
is a metric that tells us in percentage how many impressions were lost of the total eligible impressions because of the low budget.
Lost impression share rank or search lost IS (rank)
is a metric that tells us in percentage the number of times the ads were not displayed because of poor rank.
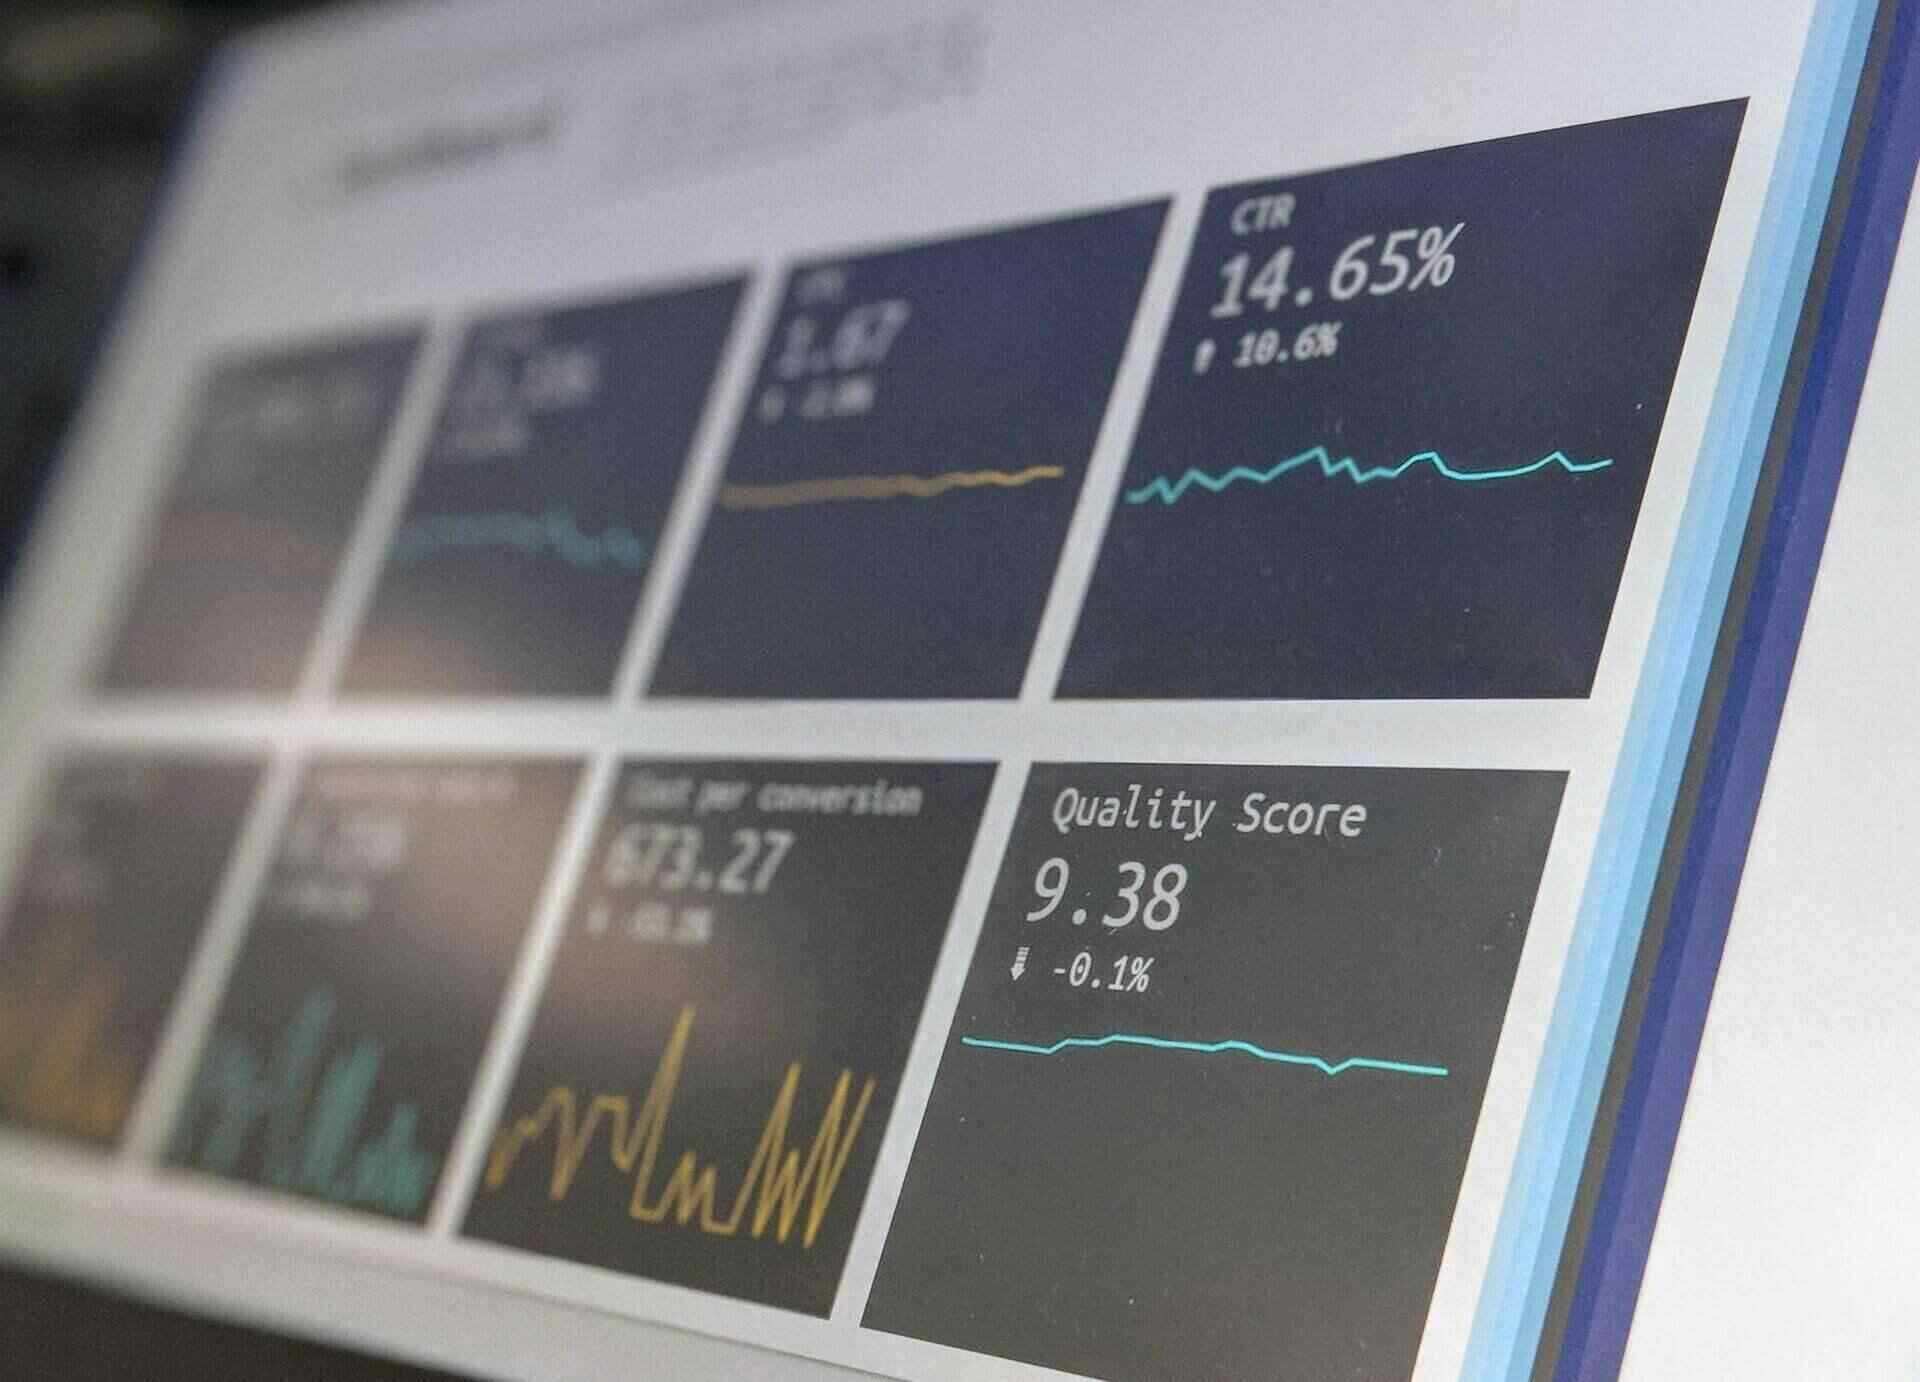
CTR
Click through rate (CTR) is the percentage (%) of the people who clicked on your campaign ad from the total impressions i.e. the number of clicks received by your ad campaign against the number of times they are viewed. For example, suppose your campaign had 20,000 impressions and 200 clicks then, your CTR will be 1%. CTR depends on various factors and one main factor among all is your ad creativity, i.e. how your ad looks. As mostly the users only click when they will find the ad relevant & appealing.
Formulae: CTR = (total measured clicks/total measured impressions)100
Leads
The meaning of the term ‘lead’ often varies depending on the organization/business. The constant thing is that lead will potentially become your future client. It can be said that a lead is any person who shows interest in your company’s product or services. If we talk in the context of sales, then lead refers to contact with a potential customer. In digital marketing, lead generation is the step defined as getting visitors to take desired action on your website.
Revenue
Revenue refers to the overall amount of money that has been produced by a company’s operations and it also consists of discounts or deductions for the returned products. It is the figure of gross income from which cost is deducted in order to determine the net income. This should be the go-to metric when considering how the ads are doing.
Cost
Perhaps the most important metric, the cost is the monetary value, the amount that you pay, or give to receive something. It is a huge part of any report as it helps in determining whether you are taking maximum advantage of your advertising money or not. You can explore budget-specific Google Ads metrics like cost per acquisition (CPA) and cost per click (CPC) to make sure your money is being well spent.
Cost per click or CPC is significant in determining the success of your campaign financially as it is the amount you pay for each click. Whereas cost per acquisition or CPA focuses on how much you pay to acquire a conversion. Both these metrics combined help in concluding whether your campaign is making money or not.
Conversion rate
Conversion rate is the rate at which the audience is taking the intended action after clicking your ad. Conversion rate gives you a good insight into whether or not your ads are performing well and reaching the right people. It is an incredible marketing performance metric to determine how the ads are performing. Comprehensive reports help in understanding its upward or downward trends, hence conversion rate optimization should be one of your prime focus.
For example, if last month, your website registers 100,000 interactions and a total of 10,000 conversions, then your conversion rate is 10,000/100,000 = 10%. This metric is perhaps the best to evaluate the performance of an ad campaign, thus you should always aim to optimize conversion rate of your ad campaign.
Formulae: Conversion rate = total number of conversion / total number of interactions
Avg. ticket
The average ticket is a company performance metric. It helps in analyzing sales and provides details on the average amount of sales per customers.
In terms of statistics, the average ticket is the mean that is calculated by adding total sales over a specific period of time and then dividing it by the number of customers. While analyzing the performance of the business, its sales activities, profits, etc. average ticket is used by the majority of the organizations.
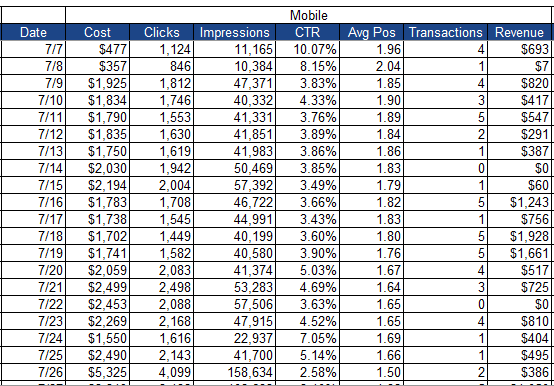
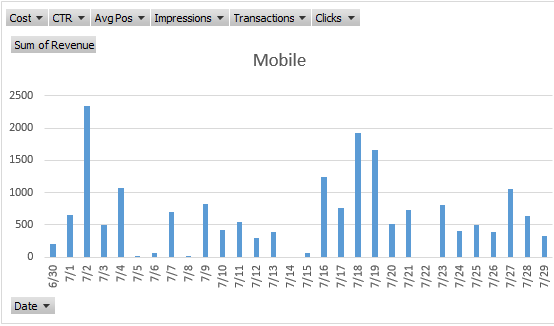
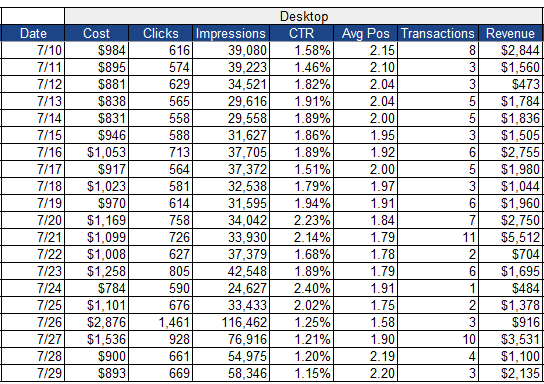
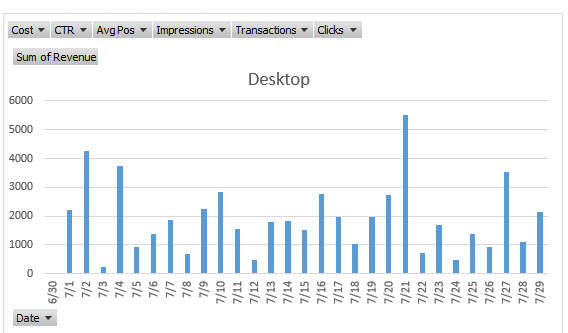
For more clarity below is the table and graph image of the above-mentioned metrics based on devices - mobile & desktop.
Why are the above metrics important?
Metrics are very crucial as they help in evaluating the performance of the campaign. It supports various business strategies including finance, marketing, competition, etc. Moreover, the metrics suggest that the process is good enough for meeting the requirements of the customers’ or it needs to be improved. Some of the above mentioned metrics come under competitive metrics that provide a competitive insight into PPC ad performance.
It can be tough to find meaningful information from the wealth of data available, so these metrics help in making sense of the data and save time, otherwise, it would be like finding a needle in a haystack. Besides that, if you outsource SEO services or PPC services to an offshore digital marketing agency, these metrics can help you in making sense of the insights discussed in the reports and you can actively collaborate with your outsourcing partner on ideas.
Year-over-year
Year-over-year (YoY) is a financial comparison that is used for comparing two or more measurable events. These comparisons are quite effective as you can evaluate the financial performance of the company and also the performance of the investments. Year over year comparisons include annual, quarterly and monthly performance.
This type of report is particularly best made of ecommerce companies as they include year-round relevant data that helps in analyzing and uncovering the trends in your PPC ad campaign, thus boosting ecommerce growth. If you outsource ecommerce services, you can demand a YoY report from your agency to conduct a deep analysis into emerging patterns.
The best part about a YoY report is that it negates the effect of seasonality as it compares specific points in time. For example, if you're comparing sales for boots between periods, you'll observe that your sales are doing better in winters than in summers, so comparing summer sales from different years will help establish the month in which the sales increase and you can optimize your ad campaign based on this insight. YoY comparison helps smooth out fickleness throughout the year to compare net results.
Benefits of year-over-year:
There are various benefits of using YoY comparisons. Some of them are:
• It helps in the cross comparison of different sets of data. If you want to know the revenue of a company’s first quarter then, it can easily be found whether the revenue is rising or falling. This can be done by a financial analyst or an investor by comparing the years of first quarter revenue data.
• Here calculation is quite easy and simple as there is no need for any financial calculator or spreadsheet.
• YoY comparison states the results in percentage (%). This makes the comparison easy across different campaigns.
How to calculate YoY growth:
• Subtract this year’s value with last year’s value. This will provide you the total difference for the year. If the difference is positive, it indicates YoY gain and vice-versa. For example: If this year you sold 100 pairs of shoes. Last year you sold 90 pairs. So, in comparison with last year, you sold 10 more pairs of shoes this year.
• Now, divide the differences by last year’s value i.e. 10 pairs of shoes divided by 90 pairs. After that put it into percent (%) format which is 10/90 = 0.111 or 11.11%.
(Same way you can calculate MoM growth. Only you need is instead of this year and last year’s value, use this month and previous month’s value).
Note: Year-over-year growth = [(this year’s value-last year’s value)/last year’s value] 100.
Month-over-month:
Month-over-month shows the monthly changes in the values of metrics like, percentage of previous month’s value. MoM is used for measuring the growth rate of a company’s monthly revenue, number of active users, subscriptions, or other key metrics. It helps in tracking the growth in the value of stocks, etc.
Month-over-month reporting is great for highlighting recent fluctuations in the performance of your campaign. This type of report provides trend insights as it includes historical data from the previous month. It helps in identifying the positive or negative aspects of the performance of your campaign. Growth on a monthly basis is a great indicator of your campaign gaining short-term impetus. As the duration increases and you're able to collect meaningful historical data, it gets easier to analyze the performance and use those learnings to optimize the campaign.
MoM analysis makes it easier to spot trends in business. For example, XYZ pvt. ltd. sells gifts online and observes a huge variance in sales from month to month. They compare the monthly sales for the last three years and observe that in every year, their conversion rate increases by 15% in november, another 25% in december and peaks with another 30% in january. The percentage drops dramatically in february. XYZ pvt. ltd. used these numbers to ascertain that they need to buy extra inventory in october when it was less expensive and detract on inventory purchase by the end of december. Thus, month on month information proves to be extremely valuable when it comes to evaluate trends.
How to calculate:
Formulae: Month-over-year growth = [(this month’s value-last month’s value)/last month’s value]100.
Week-over-week:
Week over week report is used by companies to gauge sales performance and other important KPIs on a weekly basis. A week's analysis is perfect to measure the performance of your campaign as there is enough meaningful information to work with. A day's data is often limited to give any significant outcome and a month is a long time which might lead you to miss out on actionable opportunities.
WoW report is incredibly helpful in examining short-term data that is affecting your ad campaign. The general objective of a weekly report is to track the project and its budget, and shed some light on the week's significant accomplishments, challenges and roadblocks along with the aims for the coming week.
How to calculate:
Formulae: Week-over-year growth = [(this week’s value-last week’s value)/last week’s value]100.
Reports from an SEO perspective
Although the above reports are prepared mainly from a PPC perspective, the information from these reports can be adapted to improve SEO as well. The reports gauge the campaign performance by taking into account the goals of the campaign, conversion, or intended action taken by the audience and important metrics. Laced with this information, the performance of a campaign is analyzed on all parameters and the acquired information is used to optimize the campaign.
Creating a white label SEO report is a completely different ball game. It can be a daunting task as there is no template to follow, as every business and organization have different goals to measure. You can use Google Analytics or Search Console to pull data to create the perfect SEO report. For example, if you want to discover where the traffic on your website is coming from then the source/medium section of the traffic report in Google Analytics. This information will help you invest your money more wisely.
Another important metric to measure consistently is the conversion rate or goal completion. This is the star metric of any SEO report because that is what you want your traffic to do - convert. Again, Google Analytics does an impeccable job of tracking conversions, just go to: conversions > goals > overview
Google Search Console provides actionable data-driven insights to increase the value of your report. If you are creating a keyword report and want to check the rankings of all your keywords, then Search Console is a good place to begin. Let's say you want to improve the ranking of your under-performing keywords, so to find these keywords, you first need to go to the “search results” report in Google Search Console and set the average CTR and position data. From the results, you can skim the under-performing keywords and determine whether the keyword has optimization potential.
Search Console also provides search query reports from where you can extract relevant queries, within your selected date range, that are getting a high number of clicks. This information can then be added to your SEO report to highlight the keywords that should be added in your website content. This can sky-rocket your content marketing efforts. Not only that but Search Console can help you create meticulous reports that can help improve your website performance as it flags various issues deemed 'penalty-worthy' by Google. You can even conduct backlink analysis with the help of Search Console.
Similarly, Google Search Console provides a lot of data work with. When all these data are placed meticulously in an SEO report, it shows room for improvement within your SEO campaign. Even if you outsource SEO reseller services, you can ask your agency for white label SEO report as it makes for an effective monitoring process providing incredible insight into the areas of your website that require improvement. They allow you to move forward with your ideas and plans by turning the numbers into an actionable report.
Conclusion
Creating a good report is like playing a long shot for your business as it helps in the optimization of your strategy on a set periodic basis as they help in reviewing the performance from different angles. A good white label report helps in identifying long-term and short-term goals.
The option to compare different time-frames in the same report – like year on year (YoY), month on month (MoM), month till date (MTD), quarter till date (QTD), etc. – makes for a comprehensive report that is not only insightful but also actionable in every right. Effective reporting makes it easier to track performance and offer solutions where needed.
References:
• 10 Visual Google Ads PPC Reports You Should Use
• How to create PPC reports people will actually read